

As discussed in the first part of this series, markets have a history of repeated cycles of euphoria, crashes, and recoveries. Currently, we have four concerns that are creating navigational risk but could ultimately provide unique opportunities: monetary policy irresponsibility, rules-based strategies, the Volcker Rule, and uncoordinated circuit breakers.
To understand these risks, we must first look at the history of market cycles and understand why they recur.
New Movie, Same Plot
Looking back at the past four decades is like watching remakes of the same movie. We watched the original play out in the 1980s, and remakes in the 1990s and 2000s. Now we're on version four. Each version is a little different, but the basic plotline is the same.
The First Wave
The first episode from which we draw lessons started in the mid-1980s and culminated in the Black Monday crash of October 1987. While this crisis was short-lived, responses to this crisis set in motion much of what motivates our current concerns.
The Plaza Accord was implemented in September 1985 to depreciate the dollar, but when it subsequently lost 40% of its value, the Louvre Accord was implemented to strengthen it again.
Between the two accords stock markets rallied, fueled by lower interest rates, good economic data, and widespread optimism encouraged by the illusion of prosperity that the Fed created. Despite being a short-lived period of monetary loosening, the S&P 500 Index performed in a manner that would become familiar to investors. It rose by 85% with low volatility between February 1985 and August 1987.
This optimism did not last long. From October 14 through October 16 of 1987, the Dow Jones Industrial Average (DJIA) declined by 10%. Investors' moods darkened.
The following Monday, October 19, which would be labeled “Black Monday,” the DJIA dropped 508 points—almost 23%—and the S&P 500 Index fell by more than 20%. Over four business days, ending on Black Monday, the S&P 500 Index plunged 29%.
Flush with confidence from its perceived successes in steering the exchange rate, breaking inflation, and ending the 1982 recession, the Fed stepped in to end the Black Monday crash by flooding the system with liquidity. It lent through the discount window, bought Treasuries, encouraged banks to lend to Wall Street, and lowered the federal funds rate. (Neely, Christopher J. “The Federal Reserve Responds to Crises: September 11th Was Not the First.” Federal Reserve Bank of St. Louis March (2004): 27-42)
With the birth of this so-called “Greenspan Put,” the 800-pound gorilla of U.S. monetary policy had unleashed itself on capital markets. With this series of interventions, the markets began to expect the Fed to serve as a financial market backstop.
In addition to the liquidity firehoses, policy makers moved to prevent market crashes and volatility through new regulations. These efforts, in part, institutionalized the circuit breaker, an important control mechanism that we will later discuss in more depth.
The Second Wave
With the 1987 crash in the rear-view mirror, policymakers set out to make subsequent years worry-free. In the late 1980s and early 1990s, the Fed kept interest rates low during a period of economic stability throughout the developed world.
The new economic stability mirrored financial market stability. The story went that the internet and its dot-com byproducts had created a “new economy” in which higher growth and lower volatility were the “new normal.”
This so-called “Great Moderation” established the idea that central banks had finally abolished business cycles for good. The Fed stood ready to stem any crash. There was nothing that well-meaning and seemingly thoughtful public policies couldn't do.
In the run-up to the 2000 dot-com crash, unemployment dropped below levels not seen since 1970, inflation rose to 3.7%, and the stock market surged. The economy was overheating, warranting an increase in rates, but the Fed didn't budge.
In fact, it increased the growth rate of the monetary base from 4% to 10% between 1996 and 1999, and lowered interest rates on three occasions in 1998, from 5.5% to 4.75%.
The sustained period of low rates helped push stock prices toward the sky in a narrow but large IT-sector bubble. When the Fed finally started raising rates, the bubble was already on the brink of bursting. Between March 24 and May 10 of 2000, the tech-heavy Nasdaq Composite Index fell by almost 30%. The equity market rout continued into the summer of 2002.
The Third Wave
The “Fed put” was again pulled out to do its magic. After the Fed's initial put-option reactions, it stayed accommodative from 2002 to 2005, keeping the effective federal funds rate below the Taylor Rule recommendation until early 2008. (Ahrend, Rudiger., Cournède, Boris, and Price, Robert. “Monetary Policy, Market Excesses and Financial Turmoil.” OECD Economics Department Working Papers 597 (2008)) This caused a new bubble. (Taylor, John B. “Getting Back on Track Macroeconomic Policy: Lessons from the Financial Crisis.”Federal Reserve Bank of St. LouisReview 92.3 (2010): 165-176. Selgin, George, Beckworth, David, and Bahadir, Berrak. “The Productivity Gap: Monetary Policy, the Subprime Boom, and the Post-2001 Productivity Surge.”Journal of Policy Modeling 37.2 (2015): 189-207)
Just like in the period before the dot-com crash, risk-taking was encouraged by lower market volatility, with years of annual S&P 500 Index volatility at 10%. (Between April 2004 and July 2007. Measured on an annual basis). In a deceptively safe environment, the risk premia on risky assets declined. This time, investors piled money into the housing sector in search of yield.
Steadily increasing housing prices and low volatility again provided the backdrop for another new theory of the economy. This time was different. Under the new theory, stock markets were a long-term opportunity that could be ridden to inevitable new highs. In the eyes of the market, housing—being a real asset—could not decline in value, which warranted exceptionally low risk premia.
But as real estate prices declined and subprime lending began to sour, leverage in the system was quickly withdrawn. The financial system briefly seized, causing equity prices and bond yields to collapse. The equity market decline starting in 2007 again triggered the a Fed put, with the target federal funds rate dropping from 5.25% in September 2007 to below 1.0% by October 2008.
The Start of the Fourth Wave
After the Global Financial Crisis (GFC), when it seemed as if the Fed could get no more accommodative, it pushed the federal funds rate down further, largely removing any remaining market risk influences.
The Fed tagged the effective federal funds rate at 0.25% in November 2008 and then introduced quantitative easing—the mass purchases of government bonds.
Low interest rates, together with a massive fiscal stimulus package and a series of bailouts, worked like an opiate on the markets, keeping them calm and happy in the short run but inevitably sick in the end.
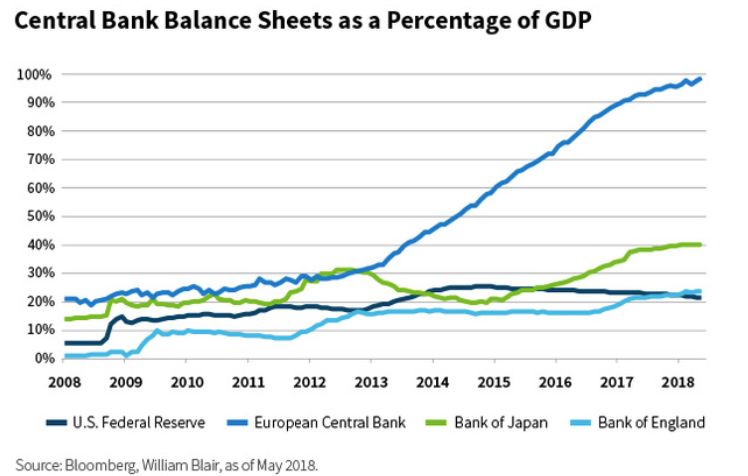
The GFC-induced Fed put became the mother of all Fed puts, extending for the subsequent 10 years and counting. The Fed expanded its balance sheet to an inconceivable 26% of GDP by 2014.
And the Fed was not alone. The Bank of England, Bank of Japan, and European Central Bank also expanded their balance sheets and all but the United States remain at historic peaks. In aggregate, the G4 central banks expanded balance sheet assets from 10% to 37% of GDP, thus obliterating the previous record of 12% in 2005.
Beyond ultra-easy developed economy monetary policies, the People's Bank of China (PBOC), through its peg to the U.S. dollar, also implemented a de facto easy-money stance.
So, there was not just one 800-pound gorilla manipulating capital markets; a troop of gorillas took the markets hostage and have held them so for more than a decade.
The lasting effects of these quantitative easing policies and the resulting malinvestment are unknown, but it is hard to see how this latest wave can end well. We'll discuss that more in our next post.
Brian Singer, CFAPartner & Portfolio ManagerWilliam Blair Investment Management
Tipp: Dieser Beitrag ist auch im "Investment Insights"-Blog von William Blair verfügbar.
William Blair Updates per E-Mail erhalten
